Efficient List Merging in Java: CompositeCollection vs Collection
When you need to merge multiple collections for read-only access in a memory-sensitive program, choosing the right method is crucial. Common methods include Stream.concat, Stream.of, and Collection.addAll.
In this post, we’ll explore why CompositeCollection from Apache Commons Collections is the best option for read-only access. We’ll benchmark CompositeCollection and addAll to compare their performance and memory efficiency, providing detailed results on memory savings and execution times.
Table of Contents
- 1. Common Ways of Merging Collections
- 2. Problem: High memory usage
- 3. A Better Approach with CompositeCollection
- 4. Performance Comparison: CompositeCollection vs. addAll
- 5. Results
- 6. Conclusion
1. Common Ways of Merging Collections
Merging collections is a frequent task in Java. Here are the most common methods:
Suppose you have the following collections you need to merge into one:
Collection<String> collection1 = Arrays.asList("A", "B", "C");
Collection<String> collection2 = Arrays.asList("D", "E", "F");
1.1 Using Stream.concat
Collection<String> mergedCollection = Stream.concat(collection1.stream(),
                                                        collection2.stream())
                                            .collect(Collectors.toList());
This can get really bad if you’re concatenating an arbitrary number of lists, as per the concat javadoc:
Use caution when constructing streams from repeated concatenation.
Accessing an element of a deeply concatenated stream can result in
deep call chains, or even StackOverflowError. Subsequent changes to
the sequential/parallel execution mode of the returned stream
are not guaranteed to be propagated to the input streams.
1.2 Using Stream.of
Collection<String> mergedCollection = Stream.of(collection1, collection2)
                                            .flatMap(Collection::stream)
                                            .collect(Collectors.toList());
1.3 Using addAll
Collection<String> mergedCollection = new ArrayList<>(collection1);
mergedCollection.addAll(collection2);
2. Problem: High memory usage
All the above solutions require copying all elements into a new collection. This duplication of elements increases memory usage, which can be problematic in memory-sensitive applications.
This is what happens:
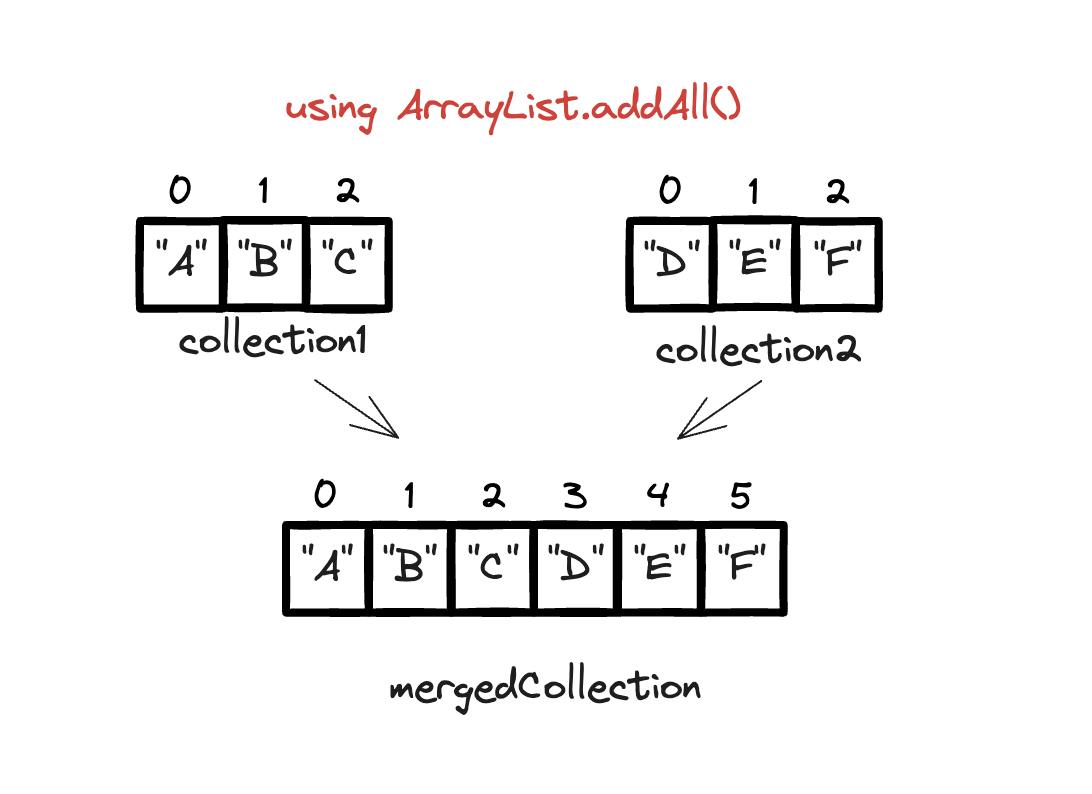
- A new ArrayList (mergedCollection) is created.
- Elements from collection1 are copied into mergedCollection during initialization.
- Elements from collection2 are copied into mergedCollection using addAll.
Memory usage increases because all elements are duplicated in the new collection.
3. A Better Approach with CompositeCollection
CompositeCollection from Apache Commons Collections provides an efficient way to create a read-only view over multiple collections without duplicating elements. Instead of creating a new collection and copying all the elements into it, CompositeCollection keeps references to the original collections.
Collection<String> collection1 = Arrays.asList("A", "B", "C");
Collection<String> collection2 = Arrays.asList("D", "E", "F");

CompositeCollection<String> allRecords = new CompositeCollection<>();
allRecords.addComposited(collection1, collection2);
Visualized:
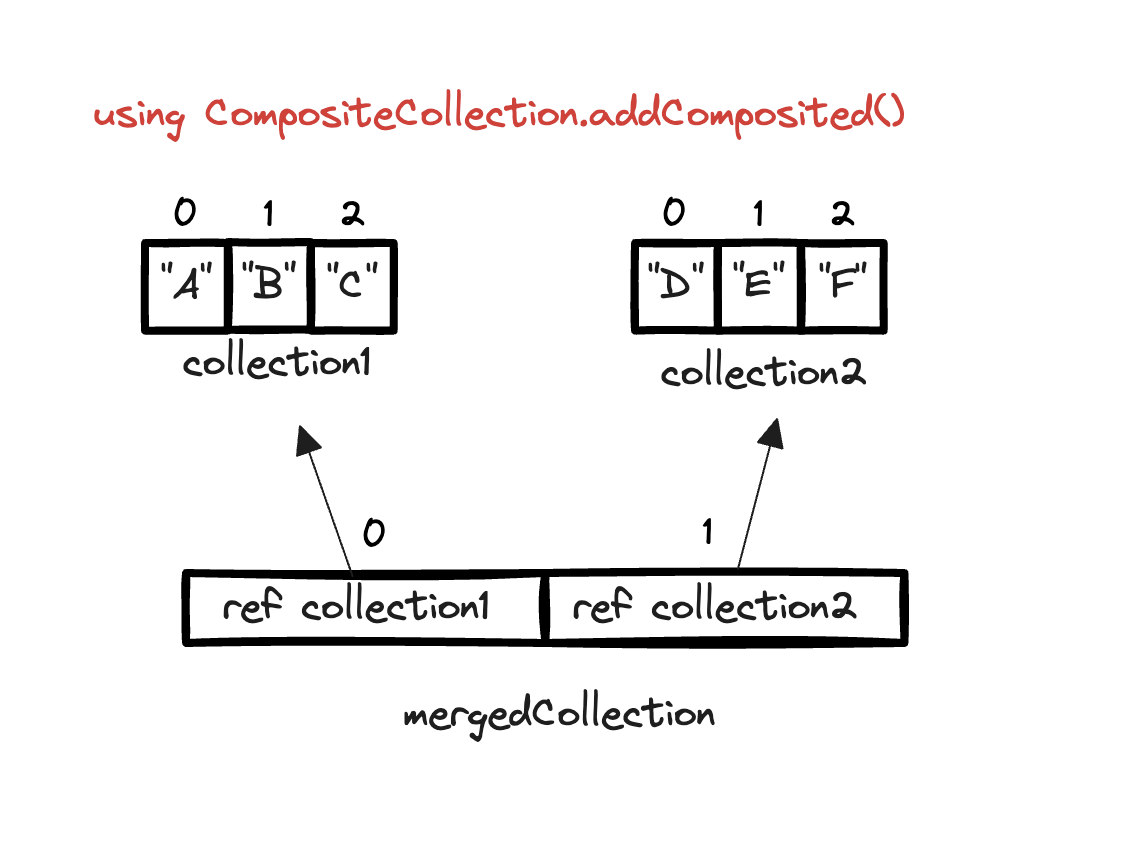
- A new CompositeCollection (mergedCollection) is created.
- References to collection1 and collection2 are added to mergedCollection using addComposited.
- No elements are copied; instead, mergedCollection maintains references to the original collections.
Benefits of CompositeCollection
- Memory Efficiency:
CompositeCollectiondoes not duplicate elements. Instead, it references the original collections, saving memory. - Read-Only View by Default: By default,
CompositeCollectionprovides a read-only view of the combined collections unless aCollectionMutatorstrategy is specified. - Flexibility: If you need to modify the
CompositeCollection, you can specify aCollectionMutatorstrategy to support add, remove, and other modification operations.
4. Performance Comparison: CompositeCollection vs. addAll
Objective
The main goal here is to test the hypothesis that CompositeCollection is more efficient in terms of execution time and memory usage compared to the traditional addAll method when merging collections. This experiment aims to provide solid evidence to support or refute this hypothesis.
Methodology
To evaluate the efficiency of CompositeCollection against addAll, I’m using the
Java Microbenchmark Harness (JMH). JMH is a Java library specifically designed for benchmarking code, providing accurate and reliable performance measurements. Using JMH helps mitigate common benchmarking pitfalls, like JVM optimizations and warm-up times, ensuring the results are robust and reproducible.
Experimental Setup
The benchmark tests cover a range of list sizes to simulate various real-world scenarios. The list sizes are defined by the @Param annotation in the JMH test, specifically:
- Small lists: 50 elements
- Medium lists: 1,000 elements
- Large lists: 10,000 elements
- Extra-large lists: 50,000 elements
Parameters and Benchmark Modes
The JMH parameters and modes are configured as follows:
- Benchmark Mode:
Mode.AverageTimeandMode.SampleTimeMode.AverageTimemeasures the average time taken for the benchmarked method to execute.Mode.SampleTimemeasures the time taken for individual samples of the benchmarked method, providing a distribution of execution times.
- Output Time Unit:
TimeUnit.MILLISECONDS- The results are reported in milliseconds for precision.
- Forks, Warmups, and Measurements:
- Fork: 1 (the benchmark process is forked once to minimize JVM startup costs)
- Warmup Iterations: 5 iterations, each lasting 1 second, to allow the JVM to optimize the code.
- Measurement Iterations: 5 iterations, each lasting 1 second, to gather performance data after the warm-up phase.
Implementation Details
The benchmark test includes two primary methods:
benchmarkAddAll: This method merges two collections using the traditionaladdAllapproach.benchmarkAddComposited: This method merges the collections usingCompositeCollectionfrom the Apache Commons Collections library.
Each method is annotated to be benchmarked under the same conditions, ensuring a fair comparison.
For the sake of reproducible software, the code and results can be found here: GitHub Repository.
We can also visualize the results by dragging the benchmark-results.json file into JMH Visualizer.
Code
package benchmark;

import org.apache.commons.collections4.collection.CompositeCollection;
import org.openjdk.jmh.annotations.Benchmark;
import org.openjdk.jmh.annotations.BenchmarkMode;
import org.openjdk.jmh.annotations.Fork;
import org.openjdk.jmh.annotations.Measurement;
import org.openjdk.jmh.annotations.Mode;
import org.openjdk.jmh.annotations.OutputTimeUnit;
import org.openjdk.jmh.annotations.Param;
import org.openjdk.jmh.annotations.Scope;
import org.openjdk.jmh.annotations.Setup;
import org.openjdk.jmh.annotations.State;
import org.openjdk.jmh.annotations.Warmup;
import org.openjdk.jmh.results.format.ResultFormatType;
import org.openjdk.jmh.runner.Runner;
import org.openjdk.jmh.runner.options.Options;
import org.openjdk.jmh.runner.options.OptionsBuilder;

import java.util.ArrayList;
import java.util.Collection;
import java.util.concurrent.TimeUnit;

@State(Scope.Benchmark)
@BenchmarkMode(Mode.SampleTime)
@OutputTimeUnit(TimeUnit.MILLISECONDS)
@Fork(value = 1, warmups = 1)
@Measurement(iterations = 5, time = 1)
@Warmup(iterations = 2, time = 1)
public class CollectionBenchmark {

    @Param({"50", "1000", "10000", "50000"})
    private int listSize;

    private Collection<String> collection1;
    private Collection<String> collection2;

    // Setup method to initialize collections before each benchmark
    @Setup
    public void setup() {
        collection1 = new ArrayList<>(listSize);
        collection2 = new ArrayList<>(listSize);
        for (int i = 0; i < listSize; i++) {
            collection1.add("A" + i);
            collection2.add("B" + i);
        }
    }

    // Benchmark method for the addAll approach
    @Benchmark
    public Collection<String> benchmarkAddAll() {
        Collection<String> mergedCollection = new ArrayList<>(collection1);
        mergedCollection.addAll(collection2);
        return mergedCollection;
    }

    // Benchmark method for the CompositeCollection approach
    @Benchmark
    public Collection<String> benchmarkAddComposited() {
        CompositeCollection<String> mergedCollection = new CompositeCollection<>();
        mergedCollection.addComposited(collection1, collection2);
        return mergedCollection;
    }

    // Main method to run the benchmark
    public static void main(String[] args) throws Exception {
        Options opt = new OptionsBuilder()
                .include(CollectionBenchmark.class.getSimpleName())
                .forks(1)
                .addProfiler("gc")
                .resultFormat(ResultFormatType.JSON)
                .result("benchmark-results.json")
                .build();

        new Runner(opt).run();
    }
}
5. Results
The benchmark tests covered four different list sizes: 50, 1,000, 10,000, and 50,000 elements. Each test was executed to compare the performance of two methods: addAll and CompositeCollection.
To interpret the results of the benchmark, it is essential to understand the various metrics used and what they signify. Here’s a brief explanation of each metric and its significance:
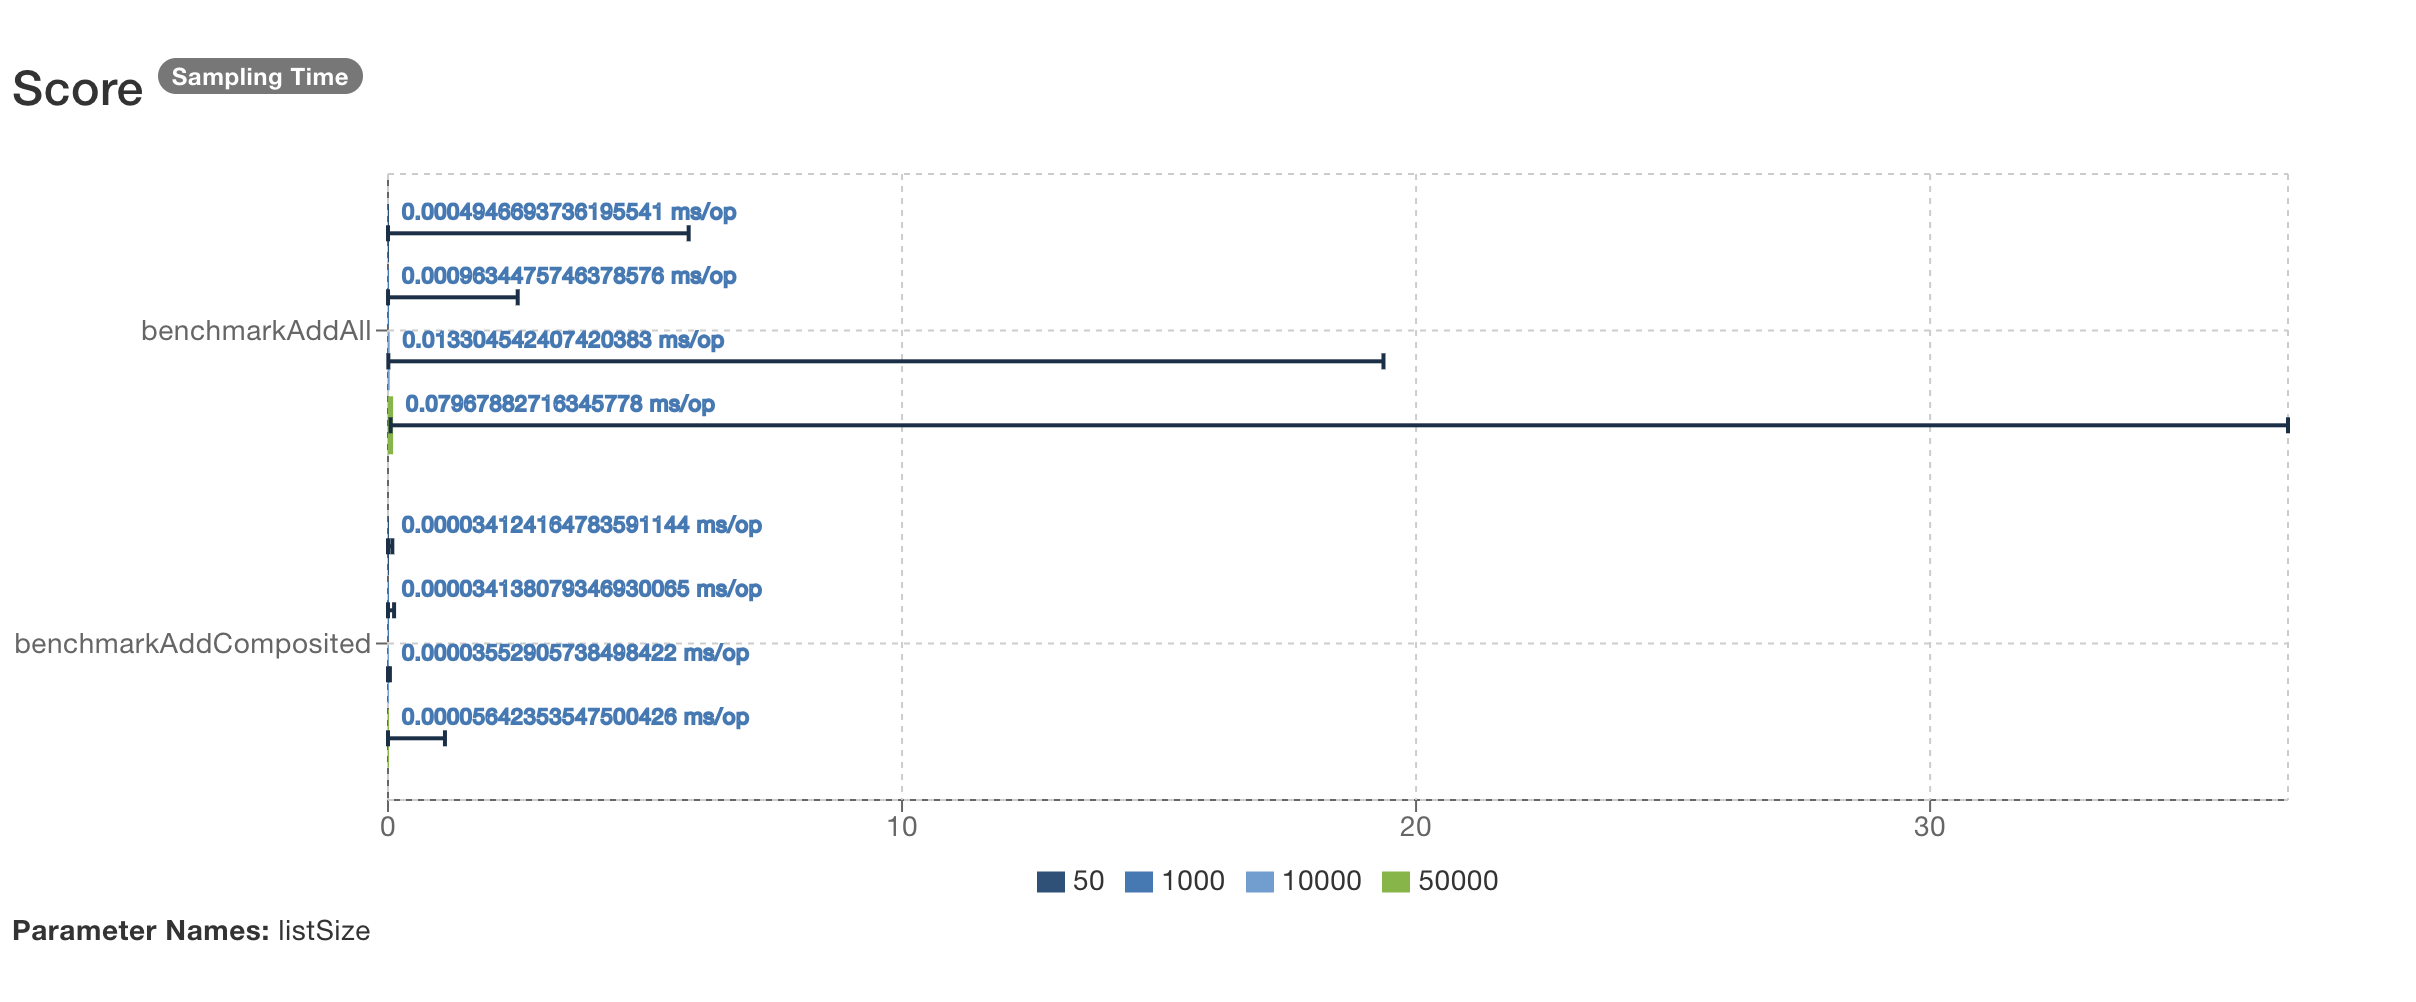
Average Execution Time (ms/op)
This metric indicates the average time taken for the benchmarked method to execute one operation, measured in milliseconds per operation (ms/op). It’s useful for understanding the typical performance of the method.
For example, if benchmarkAddAll for a parameter list size of 50 (total 100 elements) has an average execution time of ≈ 10⁻³ ms/op, it means each operation takes approximately 0.001 milliseconds to complete.
Table View - Average Execution Time (ms/op)
| List Size | benchmarkAddAll (ms/op) |
benchmarkAddComposited (ms/op) |
|---|---|---|
| 50 | ≈ 10⁻³ | ≈ 10⁻⁴ |
| 1,000 | 0.001 ± 0.001 | ≈ 10⁻⁴ |
| 10,000 | 0.013 ± 0.001 | ≈ 10⁻⁴ |
| 50,000 | 0.080 ± 0.004 | ≈ 10⁻⁴ |
GC Allocation Rate (MB/sec)
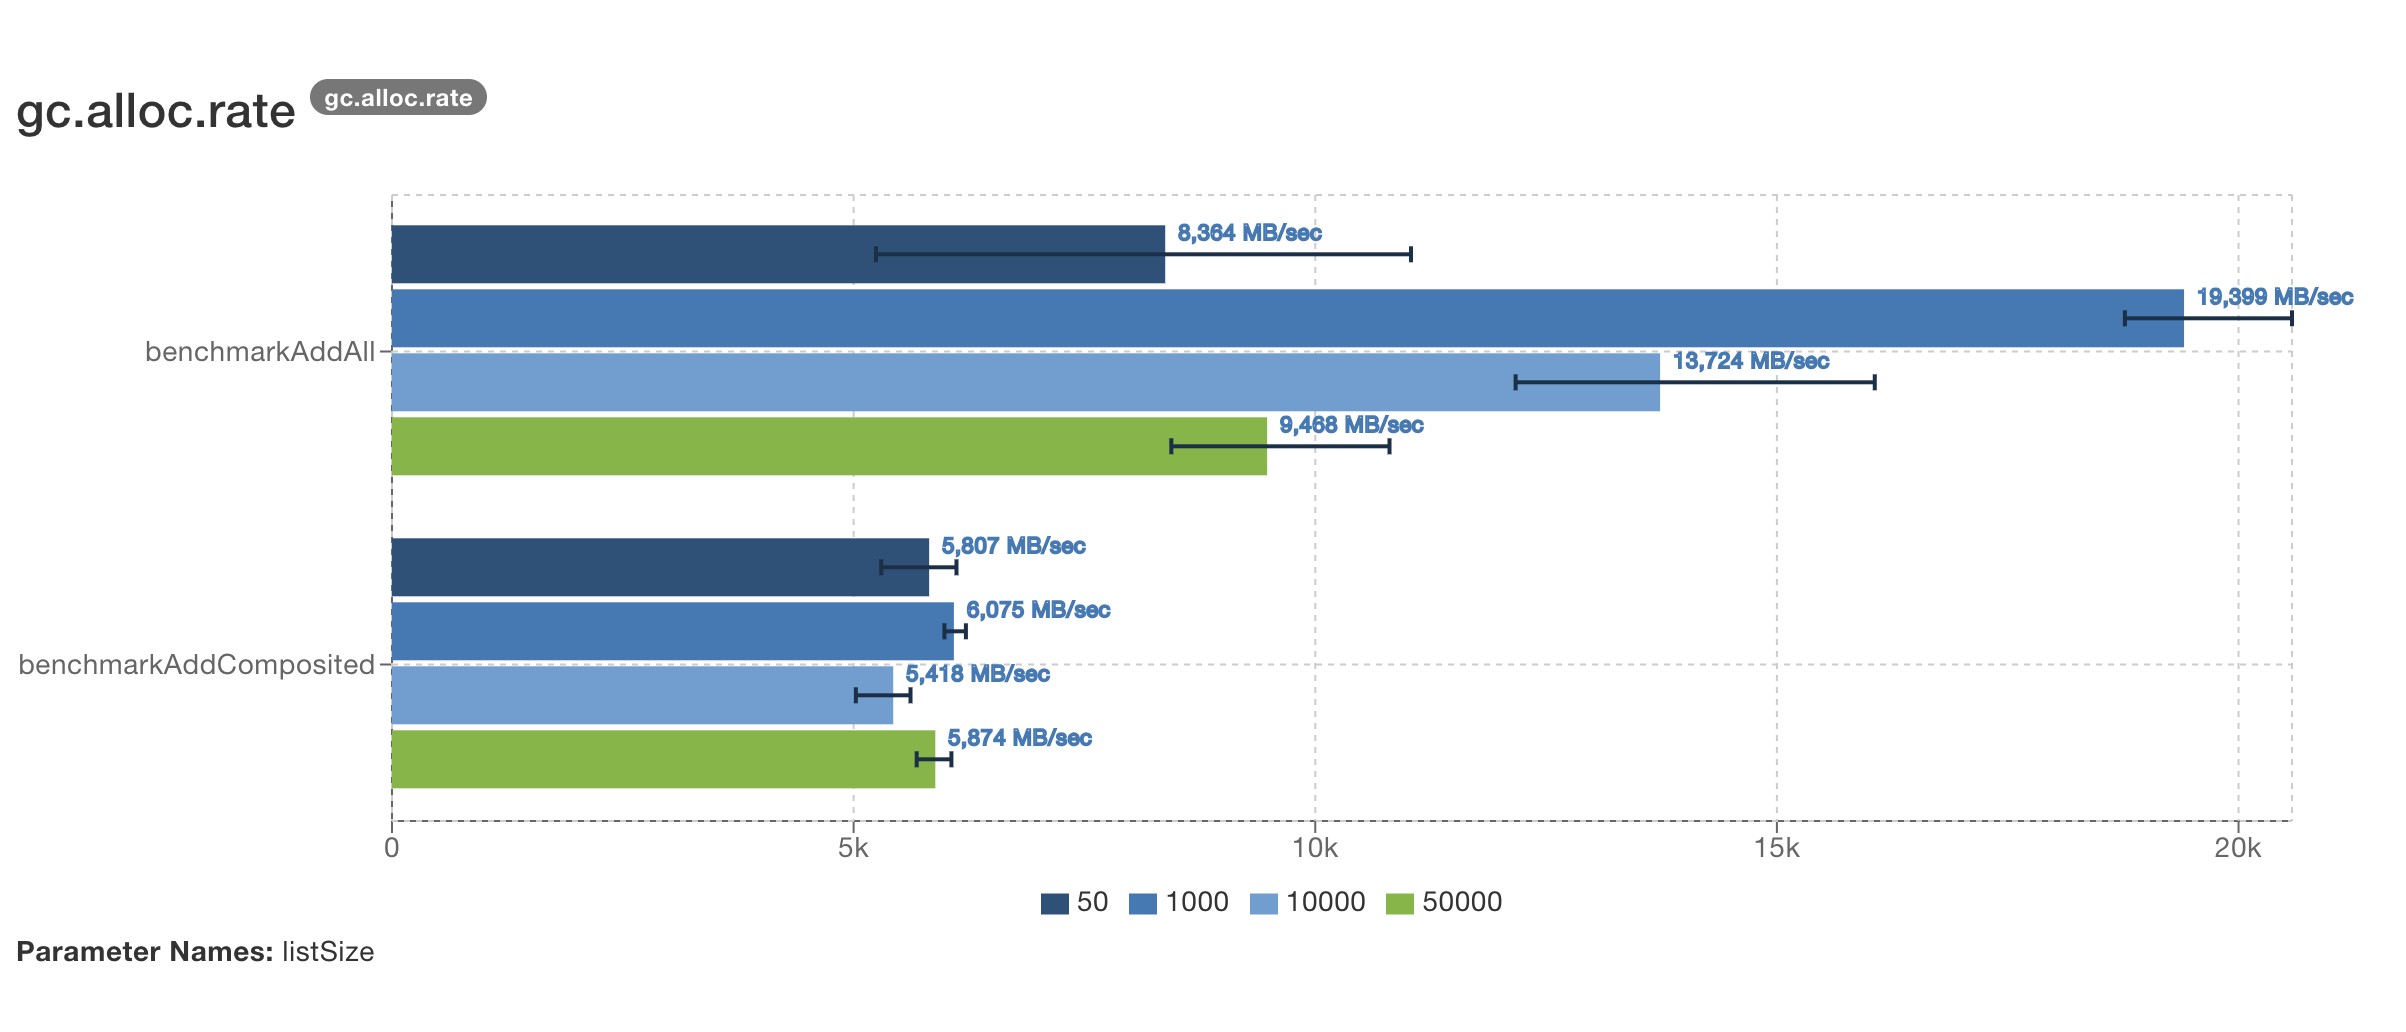
This metric shows the rate at which memory is allocated by your application code during the benchmark, as tracked by the garbage collection subsystem, measured in megabytes per second (MB/sec). A higher rate indicates your code is creating more objects that will eventually need to be garbage collected, which can impact performance due to increased GC pressure.
For example, if benchmarkAddAll for a parameter list size of 50 (total 100 elements) has a GC allocation rate of 8364.156 MB/sec, it means your code is allocating 8364.156 megabytes of memory per second that will eventually become garbage and need to be cleaned up by the GC.
Table View - GC Allocation Rate (MB/sec)
| List Size | benchmarkAddAll (MB/sec) |
benchmarkAddComposited (MB/sec) |
|---|---|---|
| 50 | 8364.156 ± 8675.603 | 5806.512 ± 1337.931 |
| 1,000 | 19399.329 ± 2669.796 | 6074.513 ± 349.277 |
| 10,000 | 13723.650 ± 6073.363 | 5417.748 ± 895.667 |
| 50,000 | 9467.641 ± 3269.808 | 5874.290 ± 643.533 |
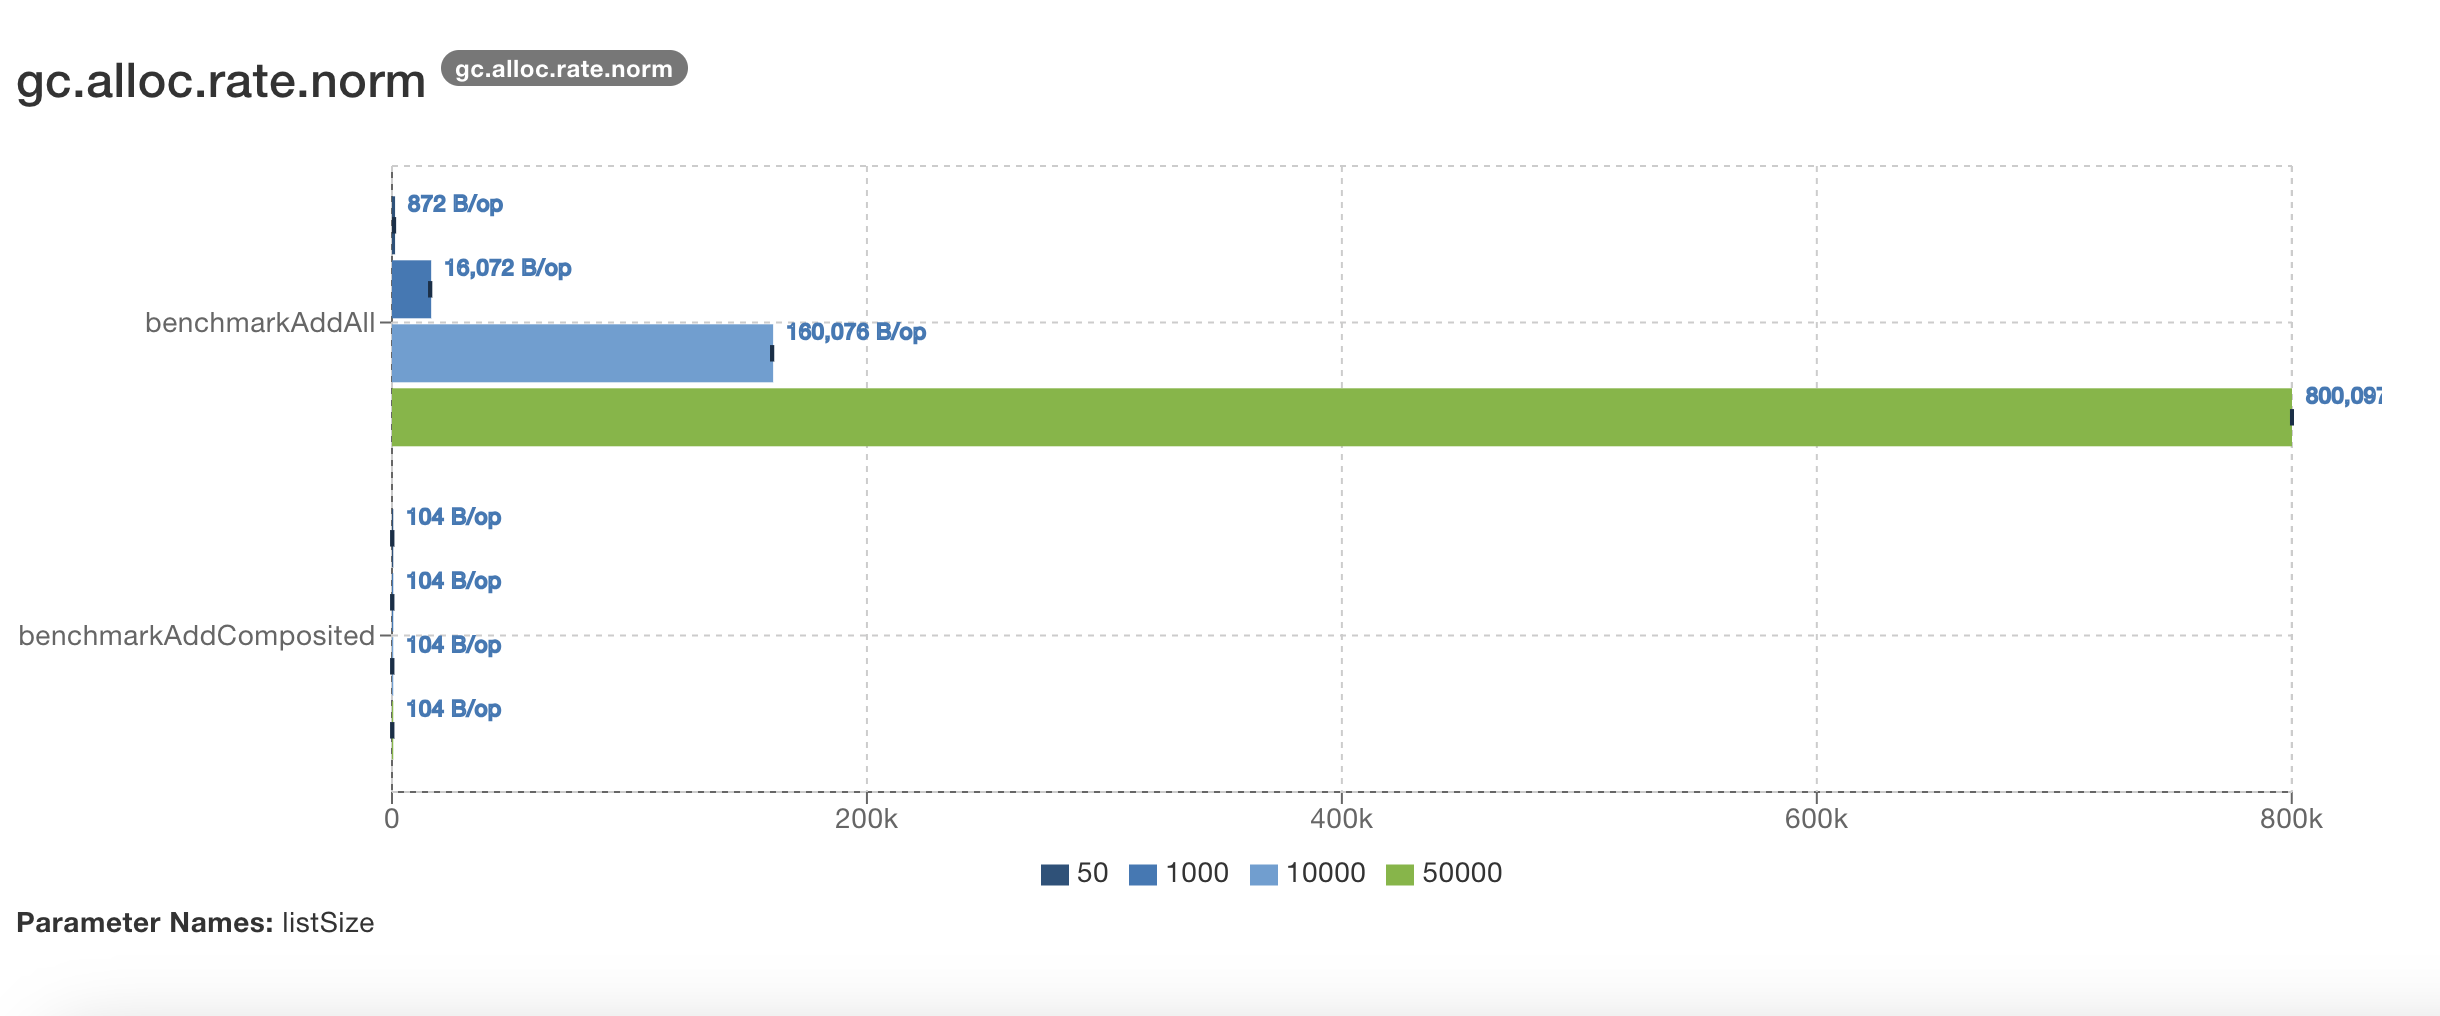
GC Allocation Rate Normalized (B/op)
This metric indicates the amount of memory allocated by the GC per operation, measured in bytes per operation (B/op). It provides insight into the memory efficiency of each operation.
For example, if benchmarkAddAll for a parameter list size of 50 (total 100 elements) has a GC allocation rate normalized of 872.033 B/op, it means each operation allocates approximately 872 bytes of memory.
Table View - GC Allocation Rate Normalized (B/op)
| List Size | benchmarkAddAll (B/op) |
benchmarkAddComposited (B/op) |
|---|---|---|
| 50 | 872.033 ± 0.047 | 104.003 ± 0.001 |
| 1,000 | 16072.248 ± 0.160 | 104.003 ± 0.004 |
| 10,000 | 160076.227 ± 3.533 | 104.003 ± 0.002 |
| 50,000 | 800097.032 ± 16.623 | 104.004 ± 0.001 |
GC Count
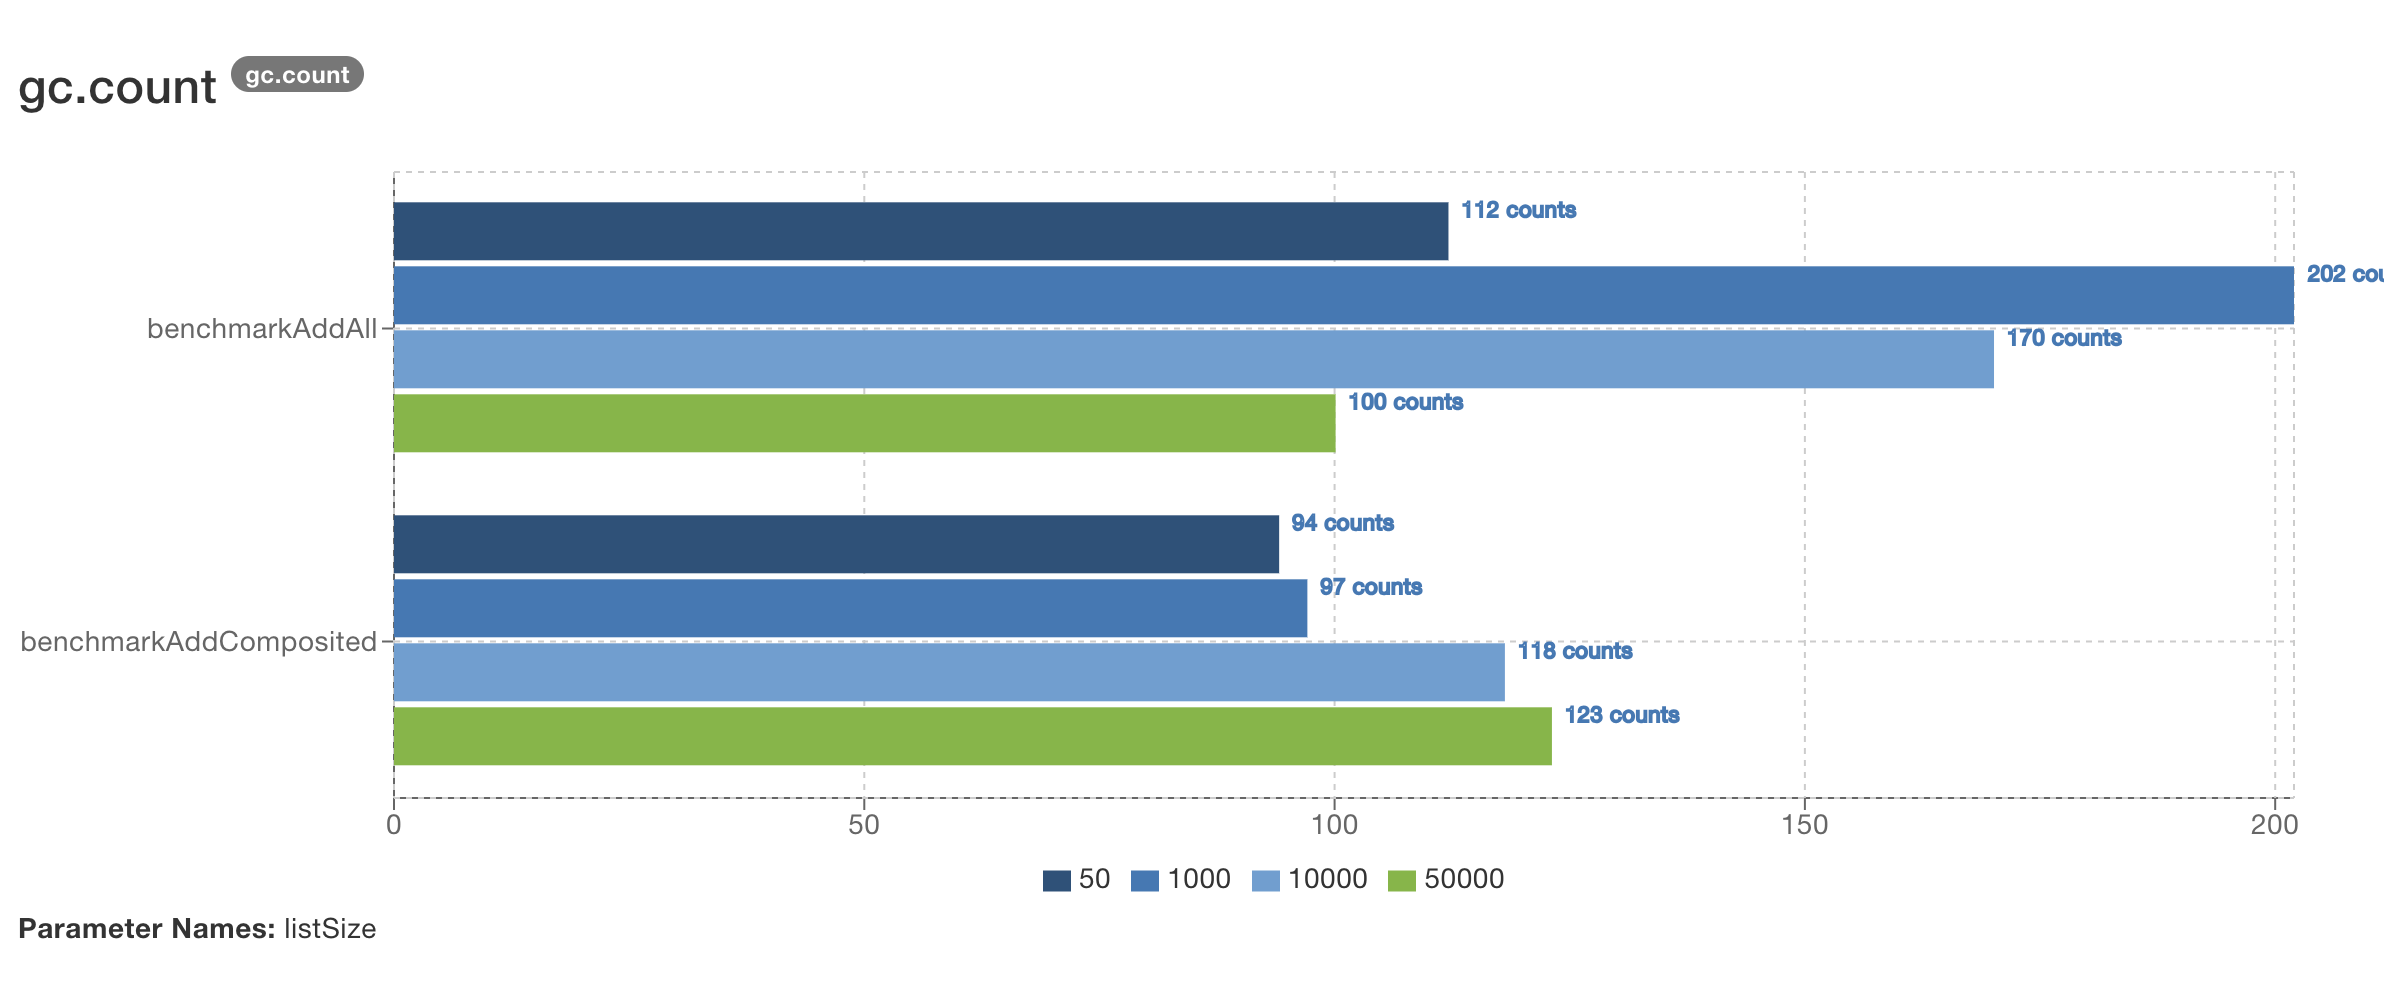
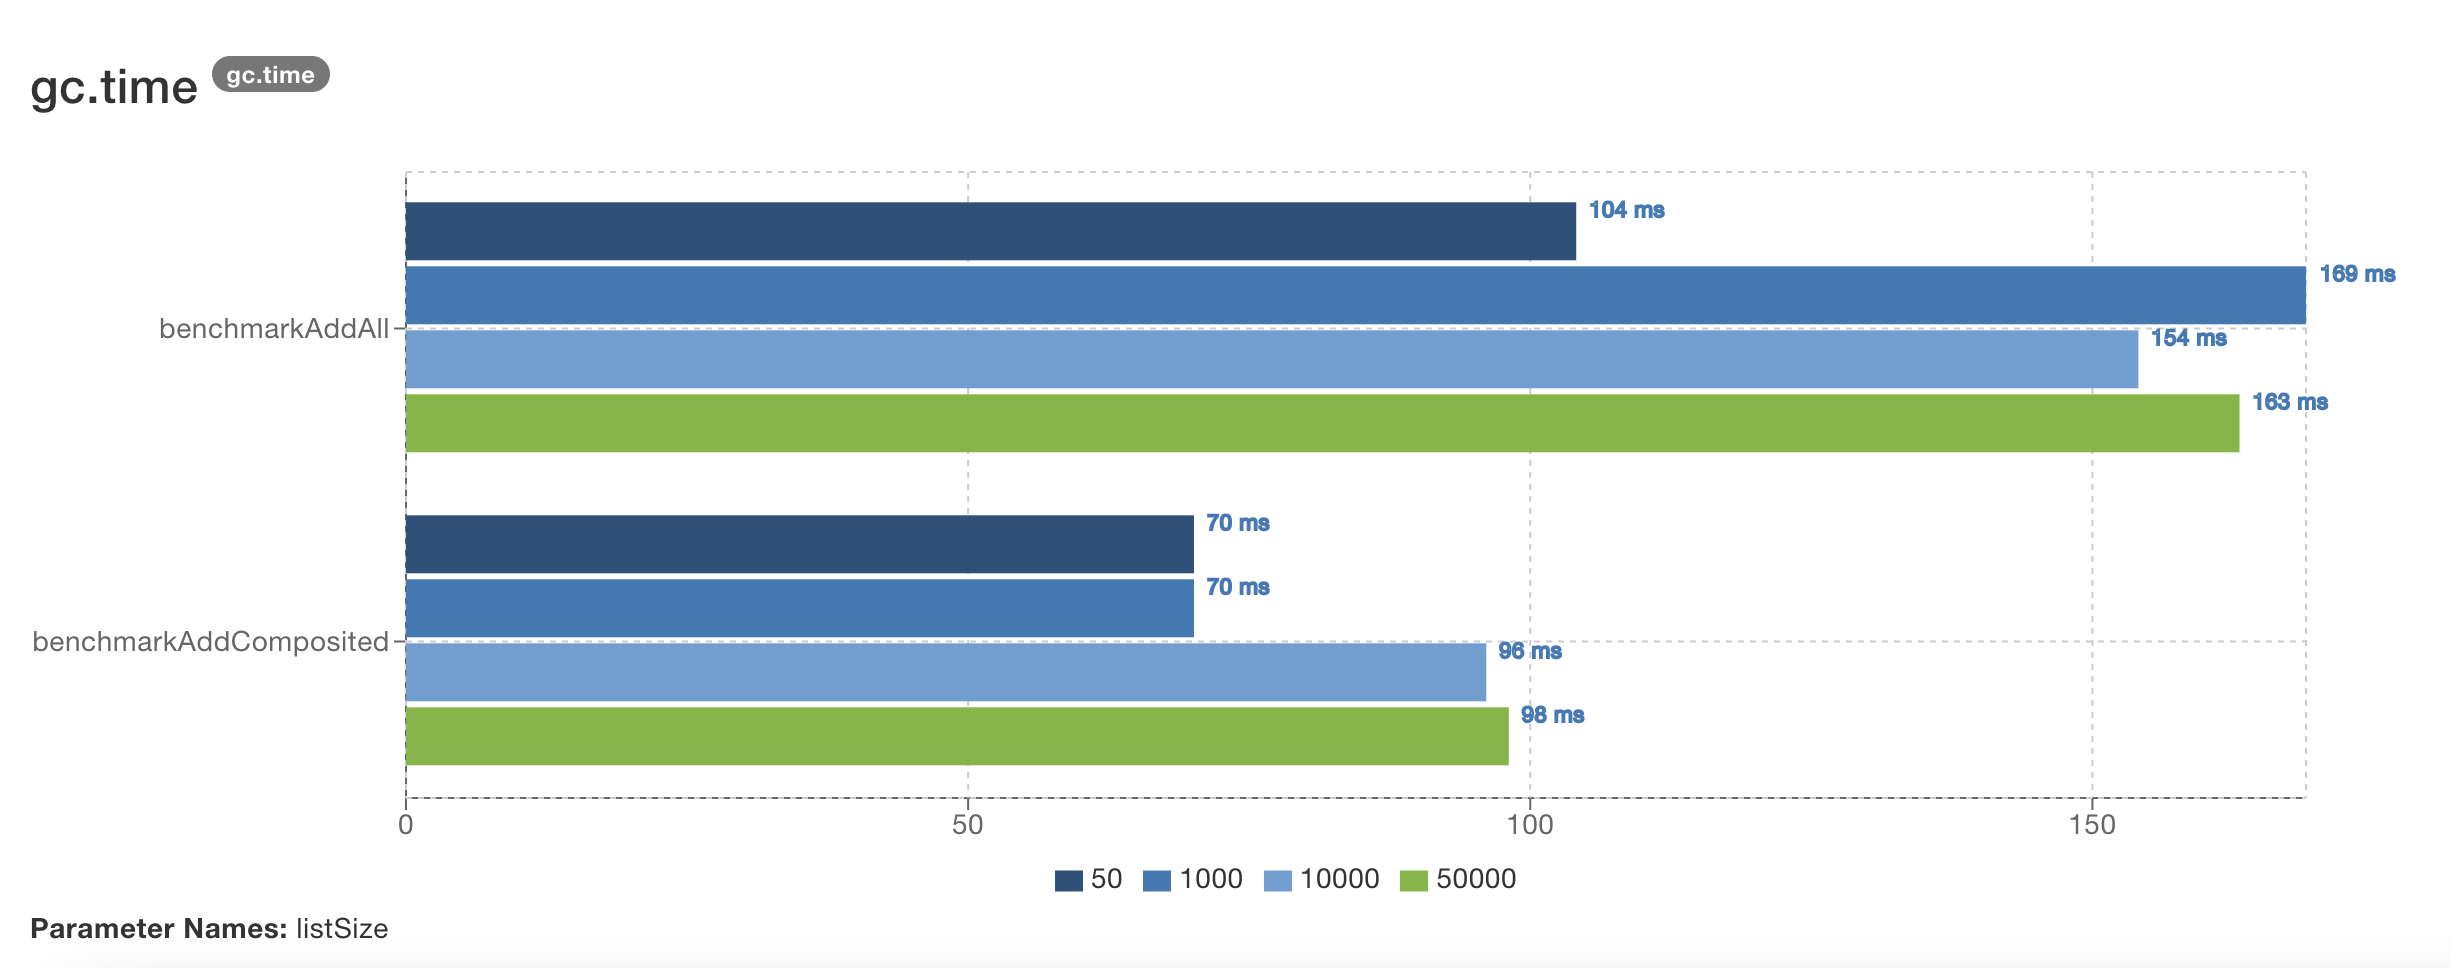
These metrics indicate the number of garbage collection (GC) events (GC Count) and the total time spent on GC (GC Time), measured in milliseconds. They provide insight into the overhead introduced by garbage collection during the benchmark.
For example, if benchmarkAddAll for a parameter list size of 50 (total 100 elements) has a GC count of 112 and a GC time of 104 ms, it means there were 112 GC events, and the total time spent on GC was 104 milliseconds.
Table View - GC Count
| List Size | benchmarkAddAll (counts) |
benchmarkAddComposited (counts) |
|---|---|---|
| 50 | 112 | 94 |
| 1,000 | 202 | 97 |
| 10,000 | 170 | 118 |
| 50,000 | 100 | 123 |
GC Time (ms)
Table View - GC Time (ms)
| List Size | benchmarkAddAll (ms) |
benchmarkAddComposited (ms) |
|---|---|---|
| 50 | 104 | 70 |
| 1,000 | 169 | 70 |
| 10,000 | 154 | 96 |
| 50,000 | 163 | 98 |
6. Conclusion
The results of our benchmark tests provide a clear comparison between the traditional addAll method and the CompositeCollection approach from Apache Commons Collections for merging collections. The data highlights significant differences in performance and resource utilization.
- Average Execution Time (ms/op):
CompositeCollectionconsistently demonstrates faster execution times compared toaddAll. This is particularly evident as the list size increases, whereCompositeCollectionmaintains a stable execution time whileaddAll’s time increases.- For a list size of 50,
CompositeCollectionis approximately 10 times faster. This ratio increases with larger list sizes.
- GC Allocation Rate (MB/sec):
- The
addAllmethod exhibits higher memory allocation rates, indicating more frequent memory allocations. This can impact performance negatively, especially in memory-constrained environments. CompositeCollectionshows a lower and more stable allocation rate, suggesting better memory efficiency.
- The
- GC Allocation Rate Normalized (B/op):
- This metric further emphasizes the efficiency of
CompositeCollection. The normalized allocation rate foraddAllis significantly higher across all list sizes. CompositeCollectionconsistently maintains a low memory allocation per operation, highlighting its memory efficiency.
- This metric further emphasizes the efficiency of
- GC Count:
- The number of GC events is notably lower for
CompositeCollection. This means less frequent garbage collection interruptions, which can contribute to better overall application performance. - For larger lists (50,000 elements),
CompositeCollectionhas a higher GC count than expected. However, the impact of these additional GC events is mitigated by the lower GC time.
- The number of GC events is notably lower for
- GC Time (ms):
- The total time spent on garbage collection is lower for
CompositeCollectionacross all list sizes. - This reduced GC time translates into fewer interruptions and better performance stability.
- The total time spent on garbage collection is lower for
Final Thoughts
The benchmark results strongly suggest that CompositeCollection is a superior approach for merging collections in Java, particularly in scenarios where both memory efficiency and execution speed are critical. By using CompositeCollection, developers can achieve significant performance improvements and memory savings, making it a compelling choice for read-only access to merged collections.
Thanks for reading :)