IntelliJ Productivity Tips for Java Developers
IntelliJ is packed with powerful features that can significantly improve your development experience. However, I’ve noticed that many developers are unaware of some of its best capabilities.
In this post, I’ll share some tips that have made a real difference in my day-to-day workflow.
1. Don’t restart your server after you modify a class
Starting a Spring Boot application can take a while, and restarting it after each class change during debugging can add up to a lot of wasted time.
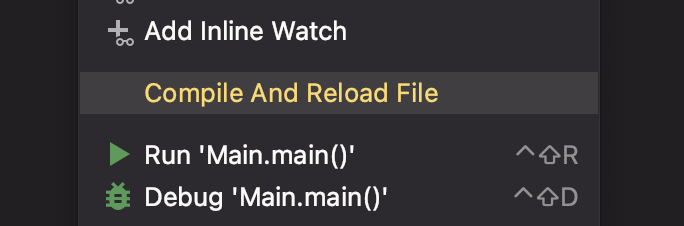
When you’re fixing a bug or just checking how your server works, you typically make changes to the code and might feel inclined to restart the server to see if those changes resolve the issue. However, there’s no need to restart the server for your changes to take effect. You can just recompile the specific classes you changed, without having to restart everything.
From IntelliJ’s documentation:
You can reload a single class
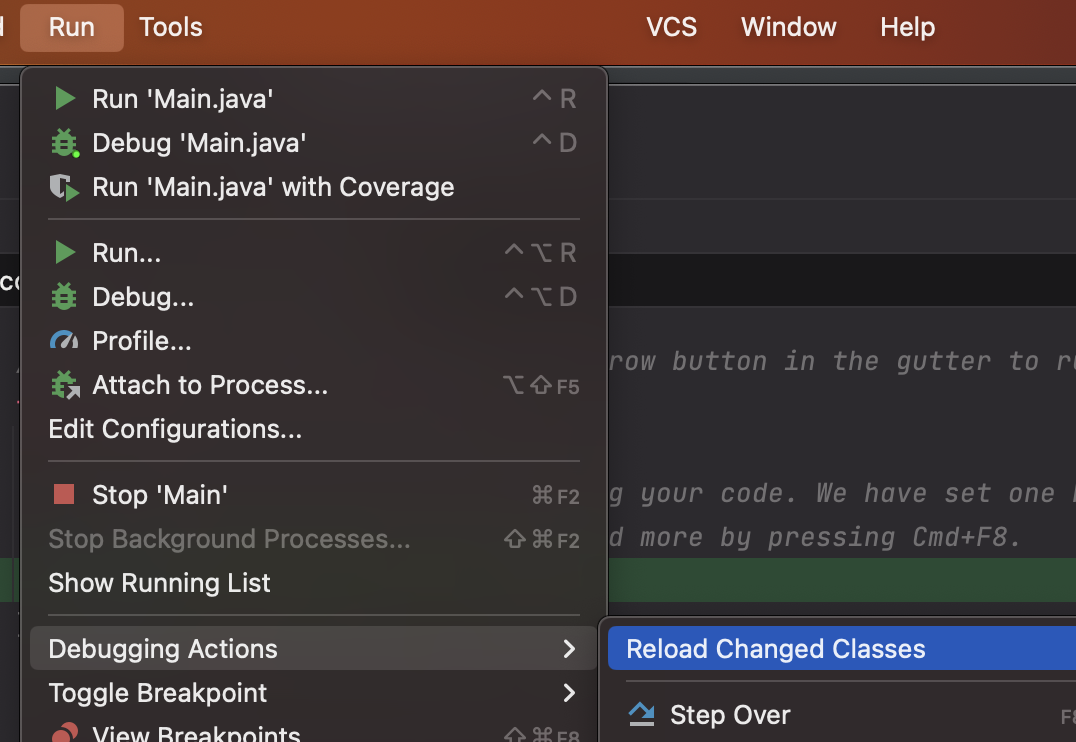
You can also reload all modified classes
Keep in mind there are some Hotswap limitations. It will only work with non-structural code changes (changing an implementation of a method). HotSwap will not work when you change the class members or method signatures.
Given how much time you’ll spend debugging, I highly recommend the entire ‘Debugging’ section from IntelliJ’s documentation, especially the Alter the program’s execution flow part.
2. Debugging backwards by exploring previous stack frames
Suppose you’re debugging and have set breakpoints in two methods: a() and b(). You’re inspecting b() but suddenly realize you need to review something in a() again. Instead of restarting the debug process, you can simply jump back to a() to re-examine what happened there. This saves you time by letting you quickly revisit previous steps without having to go through everything again.
You are currently in b()
.png)
Now you are in a()
.png)
3. Resolving dependency issues with maven helper plugin
Managing dependencies in Java can get tricky, especially when there are conflicts. The Maven Helper plugin can be a big help here. It shows you where the conflicts are and lets you fix them fast.
For example, if you have two versions of a logging library that are causing problems, Maven Helper will point them out. You can then decide which version to keep, clearing up the conflict without having to dig through your project files manually.
4. Narrow down searches with file Masks
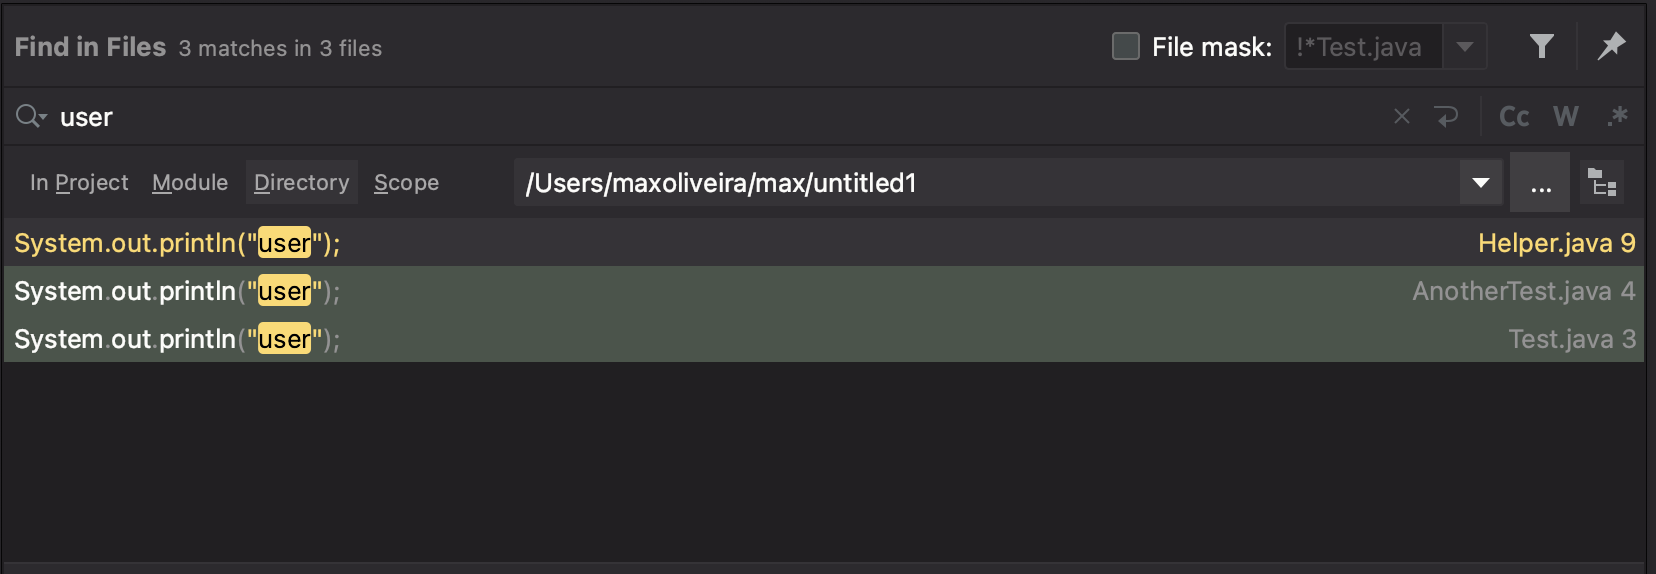
When looking for a word in your project, test files often show up too much in the results. To fix this you can use file masks. This allows you to tell IntelliJ which files you want to include or exclude in your search.
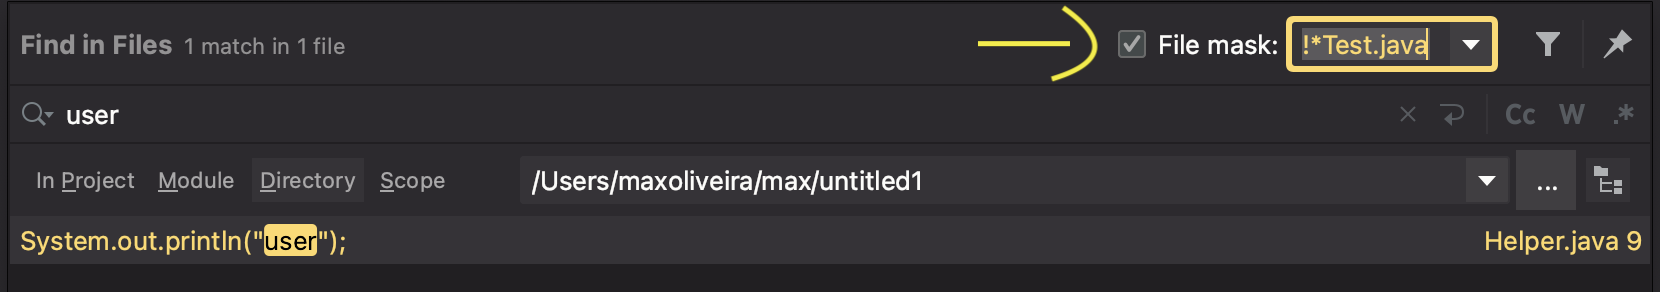
For example, if you’re trying to search for “user” but want to exclude test files, just apply the !*Test.java file mask in your search. This filters out any files with ‘Test.java’ in their name, streamlining your results.
Search without file mask
Search with file mask
You can also customise the File Mask value to your liking and exclude multiple file extensions.
5. Conditional Breakpoints
Regular breakpoints pause execution every time they’re hit, which can be frustrating when debugging loops or methods that are called frequently. Conditional breakpoints solve this by only pausing when a specific condition is met.
To set one up, right-click on an existing breakpoint (or the gutter where you’d place one) and enter a condition. For example, if you’re debugging a loop processing user records, you can set a condition like user.getId().equals("123") to only break when that specific user is being processed.
This is especially useful when:
- Debugging loops with thousands of iterations
- Investigating issues that only occur with specific data
- Avoiding the tedium of clicking “Resume” repeatedly
6. Stream Debugger
Java Streams are powerful but notoriously difficult to debug. When you set a breakpoint inside a stream pipeline, it’s hard to see what’s happening at each step.
IntelliJ’s Stream Debugger solves this. When you’re stopped at a breakpoint in a stream operation, click Trace Current Stream Chain in the debugger toolbar. This opens a visual representation showing the data transformation at each step of the pipeline — from the source, through each map, filter, or flatMap, all the way to the terminal operation.
This feature has saved me hours when debugging complex stream transformations.
7. Postfix Completion
Postfix completion lets you transform an expression by typing a dot and a keyword after it. Instead of going back to wrap your code, you type forward.
Some useful examples:
myVar.null+ Tab →if (myVar == null) {}myVar.notnull+ Tab →if (myVar != null) {}myList.for+ Tab →for (Type item : myList) {}myValue.return+ Tab →return myValue;expression.try+ Tab → wraps in try-catch block
You can see all available postfix templates in Settings → Editor → General → Postfix Completion. Once you get used to this, it becomes second nature and speeds up your coding flow significantly.